Humans are racing to harness the ocean’s vast potential to power global economic growth. Worldwide, ocean-based industries such as fishing, shipping and energy production generate at least US$1.5 trillion in economic activity each year and support 31 million jobs. This value has been increasing exponentially over the past 50 years and is expected to double by 2030.
Transparency in monitoring this “blue acceleration” is crucial to prevent environmental degradation, overexploitation of fisheries and marine resources, and lawless behavior such as illegal fishing and human trafficking. Open information also will make countries better able to manage vital ocean resources effectively. But the sheer size of the ocean has made tracking industrial activities at a broad scale impractical – until now.
A newly published study in the journal Nature combines satellite images, vessel GPS data and artificial intelligence to reveal human industrial activities across the ocean over a five-year period. Researchers at Global Fishing Watch, a nonprofit organization dedicated to advancing ocean governance through increased transparency of human activity at sea, led this study, in collaboration with me and our colleagues at Duke University, University of California, Santa Barbara and SkyTruth.
We found that a remarkable amount of activity occurs outside of public monitoring systems. Our new map and data provide the most comprehensive public picture available of industrial uses of the ocean.
Operating in the dark
Our research builds on existing technology to provide a much more complete picture than has been available until now.
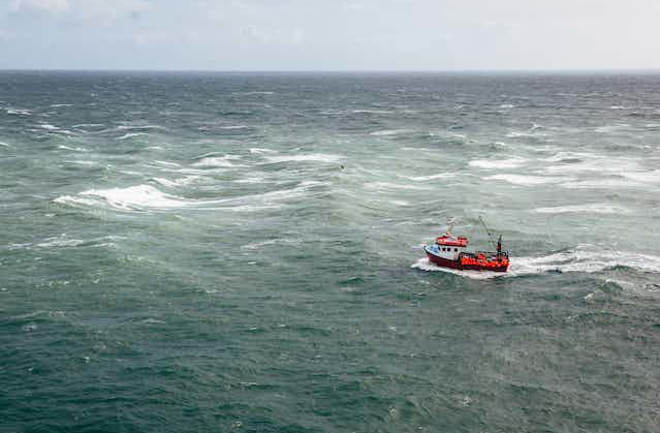
For example, many vessels carry a device called an automatic identification system, or AIS, that automatically broadcasts the vessel’s identity, position, course and speed. These devices communicate with other AIS devices nearby to improve situational awareness and reduce the chances of vessel collisions at sea. They also transmit to shore-based transponders and satellites, which can be used to monitor vessel traffic and fishing activity.
However, AIS systems have blind spots. Not all vessels are required to use them, certain regions have poor AIS reception, and vessels engaged in illegal activities may disable AIS devices or tamper with location broadcasts. To avoid these problems, some governments require fishing vessels to use proprietary vessel monitoring systems, but the associated vessel location data is usually confidential.
Some offshore structures, such as oil platforms and wind turbines, also use AIS to guide service vessels, monitor nearby vessel traffic and improve navigational safety. However, location data for offshore structures are often incomplete, outdated or kept confidential for bureaucratic or commercial reasons.
Shining a light on activity at sea
We filled these gaps by using artificial intelligence models to identify fishing vessels, nonfishing vessels and fixed infrastructure in 2 million gigabytes of satellite-based radar images and optical images taken across the ocean between 2017 and 2021. We also matched these results to 53 billion AIS vessel position reports to determine which vessels were publicly trackable at the time of the image.
Remarkably, we found that about 75% of the fishing vessels we detected were missing from public AIS monitoring systems, with much of that activity taking place around Africa and South Asia. These previously invisible vessels radically changed our knowledge about the scale, scope and location of fishing activity.
For example, public AIS data wrongly suggests that Asia and Europe have comparable amounts of fishing within their borders. Our mapping reveals that Asia dominates: For every 10 fishing vessels we found on the water, seven were in Asia while only one was in Europe. Similarly, AIS data shows about 10 times more fishing on the European side of the Mediterranean compared with the African side – but our map shows that fishing activity is roughly equal across the two areas.
For other vessels, which are mostly transport- and energy-related, about 25% were missing from public AIS monitoring systems. Many missing vessels were in locations with poor AIS reception, so it is possible that they broadcast their locations but satellites did not pick up the transmission.
We also identified about 28,000 offshore structures – mostly oil platforms and wind turbines, but also piers, bridges, power lines, aquaculture farms and other human-made structures. Offshore oil infrastructure grew modestly over the five-year period, while the number of wind turbines more than doubled globally, with development mostly confined to northern Europe and China. We estimate that the number of wind turbines in the ocean likely surpassed the number of oil structures by the end of 2020.
Supporting real-world efforts
This data is freely available through the Global Fishing Watch data portal and will be maintained, updated and expanded over time there. We anticipate several areas where the information will be most useful for on-the-ground monitoring:
– Fishing in data-poor regions: Shipboard monitoring systems are too expensive to deploy widely in many places. Fishery managers in developing countries can use our data to monitor pressure on local stocks.
– Illegal, unreported and unregulated fishing: Industrial fishing vessels sometimes operate in places where they should not be, such as small-scale and traditional fishing grounds and marine protected areas. Our data can help enforcement agencies identify illegal activities and target patrol efforts.
– Sanction-busting trade: Our data can shed light on maritime activities that may breach international economic sanctions. For example, United Nations sanctions prohibit North Korea from exporting seafood products or selling its fishing rights to other countries. Previous work found more than 900 undisclosed fishing vessels of Chinese origin in the eastern waters of North Korea, in violation of U.N. sanctions.
We found that the western waters of North Korea had far more undisclosed fishing, likely also of foreign origin. This previously unmapped activity peaked each year in May, when China bans fishing in its own waters, and abruptly fell in 2020 when North Korea closed its borders because of the COVID-19 pandemic.
Better monitoring may help nations coordinate offshore activities in busy regions like the North Sea.
– Climate change mitigation and adaptation: Our data can help quantify the scale of greenhouse gas emissions from vessel traffic and offshore energy development. This information is important for enforcing climate change mitigation programs, such as the European Union’s emissions trading scheme.
– Offshore energy impacts: Our map shows not only where offshore energy development is happening but also how vessel traffic interacts with wind turbines and oil and gas platforms. This information can shed light on the environmental footprint of building, maintaining and using these structures. It can also help to pinpoint sources of oil spills and other marine pollution.
Healthy oceans underpin human well-being in a myriad of ways. We expect that this research will support evidence-based decision-making and help to make ocean management more fair, effective and sustainable.
Fernando Paolo, senior machine learning engineer at Global Fishing Watch; David Kroodsma, director of research and innovation at Global Fishing Watch; and Patrick Halpin, Professor of Marine Geospatial Ecology at Duke University, contributed to this article.
Jennifer Raynor is an Assistant Professor of Natural Resource Economics at the University of Wisconsin-Madison. This article is republished from The Conversation under a Creative Commons license. Read the original article.